


 4 / 10

3
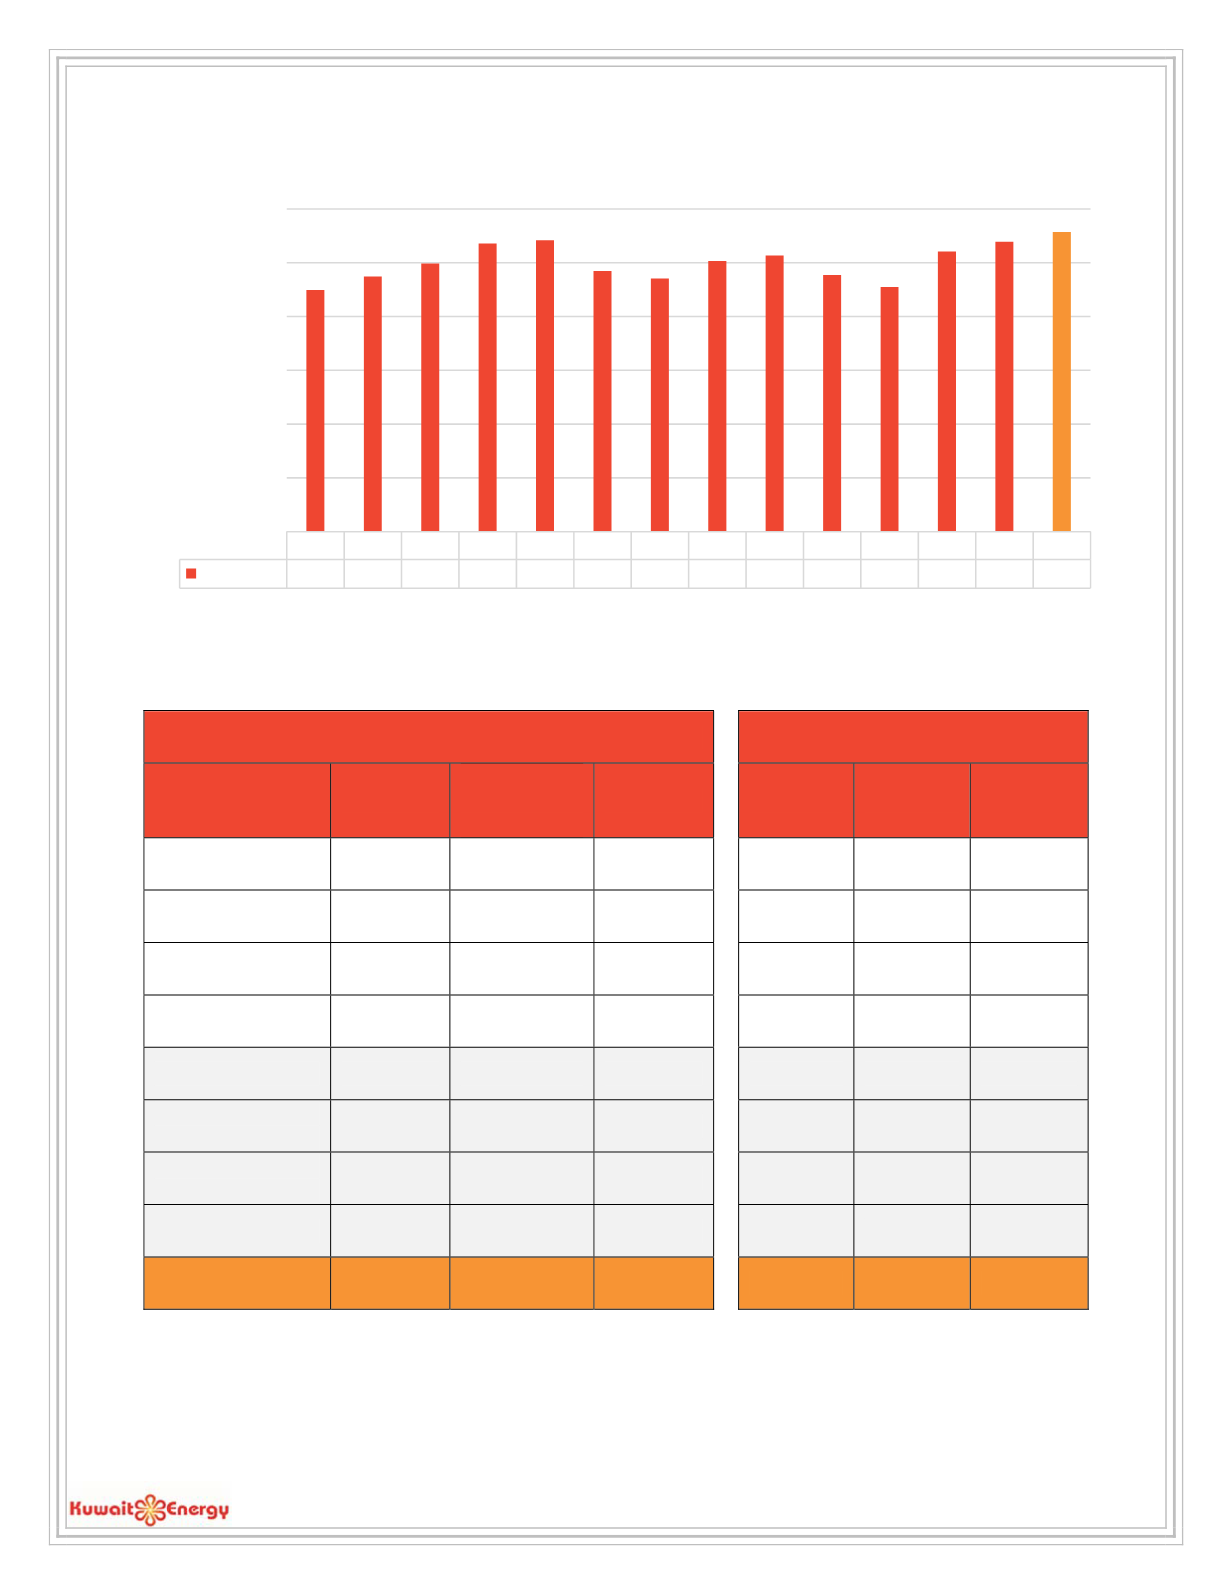
The chart below shows
quarter-by-quarter daily WI average producƟon
of the Company from Q1 2014 to Q2 2017:
Kuwait Energy’s
daily average WI share of producƟon for
the YTD June 2017 reporƟng period
compared to the
same period in
2016,
and a
comparison of the last two quarters daily producƟon averages
per asset are shown in
the tables below (in boepd):
YTD Average Comparison
Quarter on Quarter Comparison
YTD Actual
Corresponding
YTD Period -
2016
% Change
Q2 2017
Q1 2017
%
Difference
Abu Sennan
1,667
1,936
-13.9
1,702
1,633
4.2
BEA
1,143
1,733
-34.0
1,234
1,051
17.4
Area A
4,720
5,029
-6.1
4,624
4,816
-4.0
ERQ
8,643
10,357
-16.5
8,451
8,838
-4.4
Egypt Total
16,173
19,054
-15.1
16,010
16,338
-2.0
Iraq Total
(Block 9)
8,822
3,321
165.6
9,601
8,033
19.5
Oman Total
(Karim Small Fields)
2,410
2,460
-2.0
2,254
2,569
-12.2
Yemen Total*
0
0
-
0
0
-
ProducƟon Total
27,405
24,836
10.3
27,865
26,941
3.4
* Yemen producƟon has been suspended since April 2015
Q1 14 Q2 14 Q3 14 Q4 14 Q1 15 Q2 15 Q3 15 Q4 15 Q1 16 Q2 16 Q3 16 Q4 16 Q1 17 Q2 17
Production 22,467 23,720 24,921 26,780 27,099 24,223 23,522 25,151 25,679 23,859 22,742 26,041 26,941 27,865
0
5,000
10,000
15,000
20,000
25,000
30,000
BOEPD