


 30-31 / 116

31
30
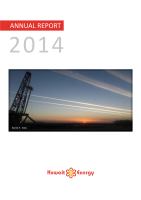
Kuwait Energy Reserves & Resources
Classification
Category
Kuwait Energy Reserves and Resources (in mmboe)
YE13
2014 Production
Exploration
Adds
Revisions
Acquisitions & Divestments
YE14
YE14 Net Entitlement
Reserves
1P
2P
3P
90.5
213.1
300.7
-7.5
169.3
509.2
1,038.4
6.8
3.2
-6.1
-0.1
-46.6
-93.5
259.0
671.3
1,232.0
68.8
108.7
152.8
Contingent
Resources
2C
853.0
0.0
-92.9
-0.7
759.4
Prospective
Resources
Best
37.1
0.0
2.7
-8.1
31.6
Total
YE14
YE13
1P RRR =
2337%
1P RRR = 61%
2P RRR =
6186%
2P RRR = -16%
Notes:
1. Certified figures by GCA.
2. Excludes KSF (Oman) which cannot be included in external reserves reporting as per contract.
3. Reserves Replacement Ratio considers acquisitions and divestment.
4. Prospective Resources estimates are risked.
5. N/E stands for Net Entitlement.
6. Totals may not exactly equal the sum of the individual entries due to rounding.
7. Ukraine and Russia were divested in 2014.
8. 2014 production is based on actuals up to November 2014 and an estimate for December 2014.
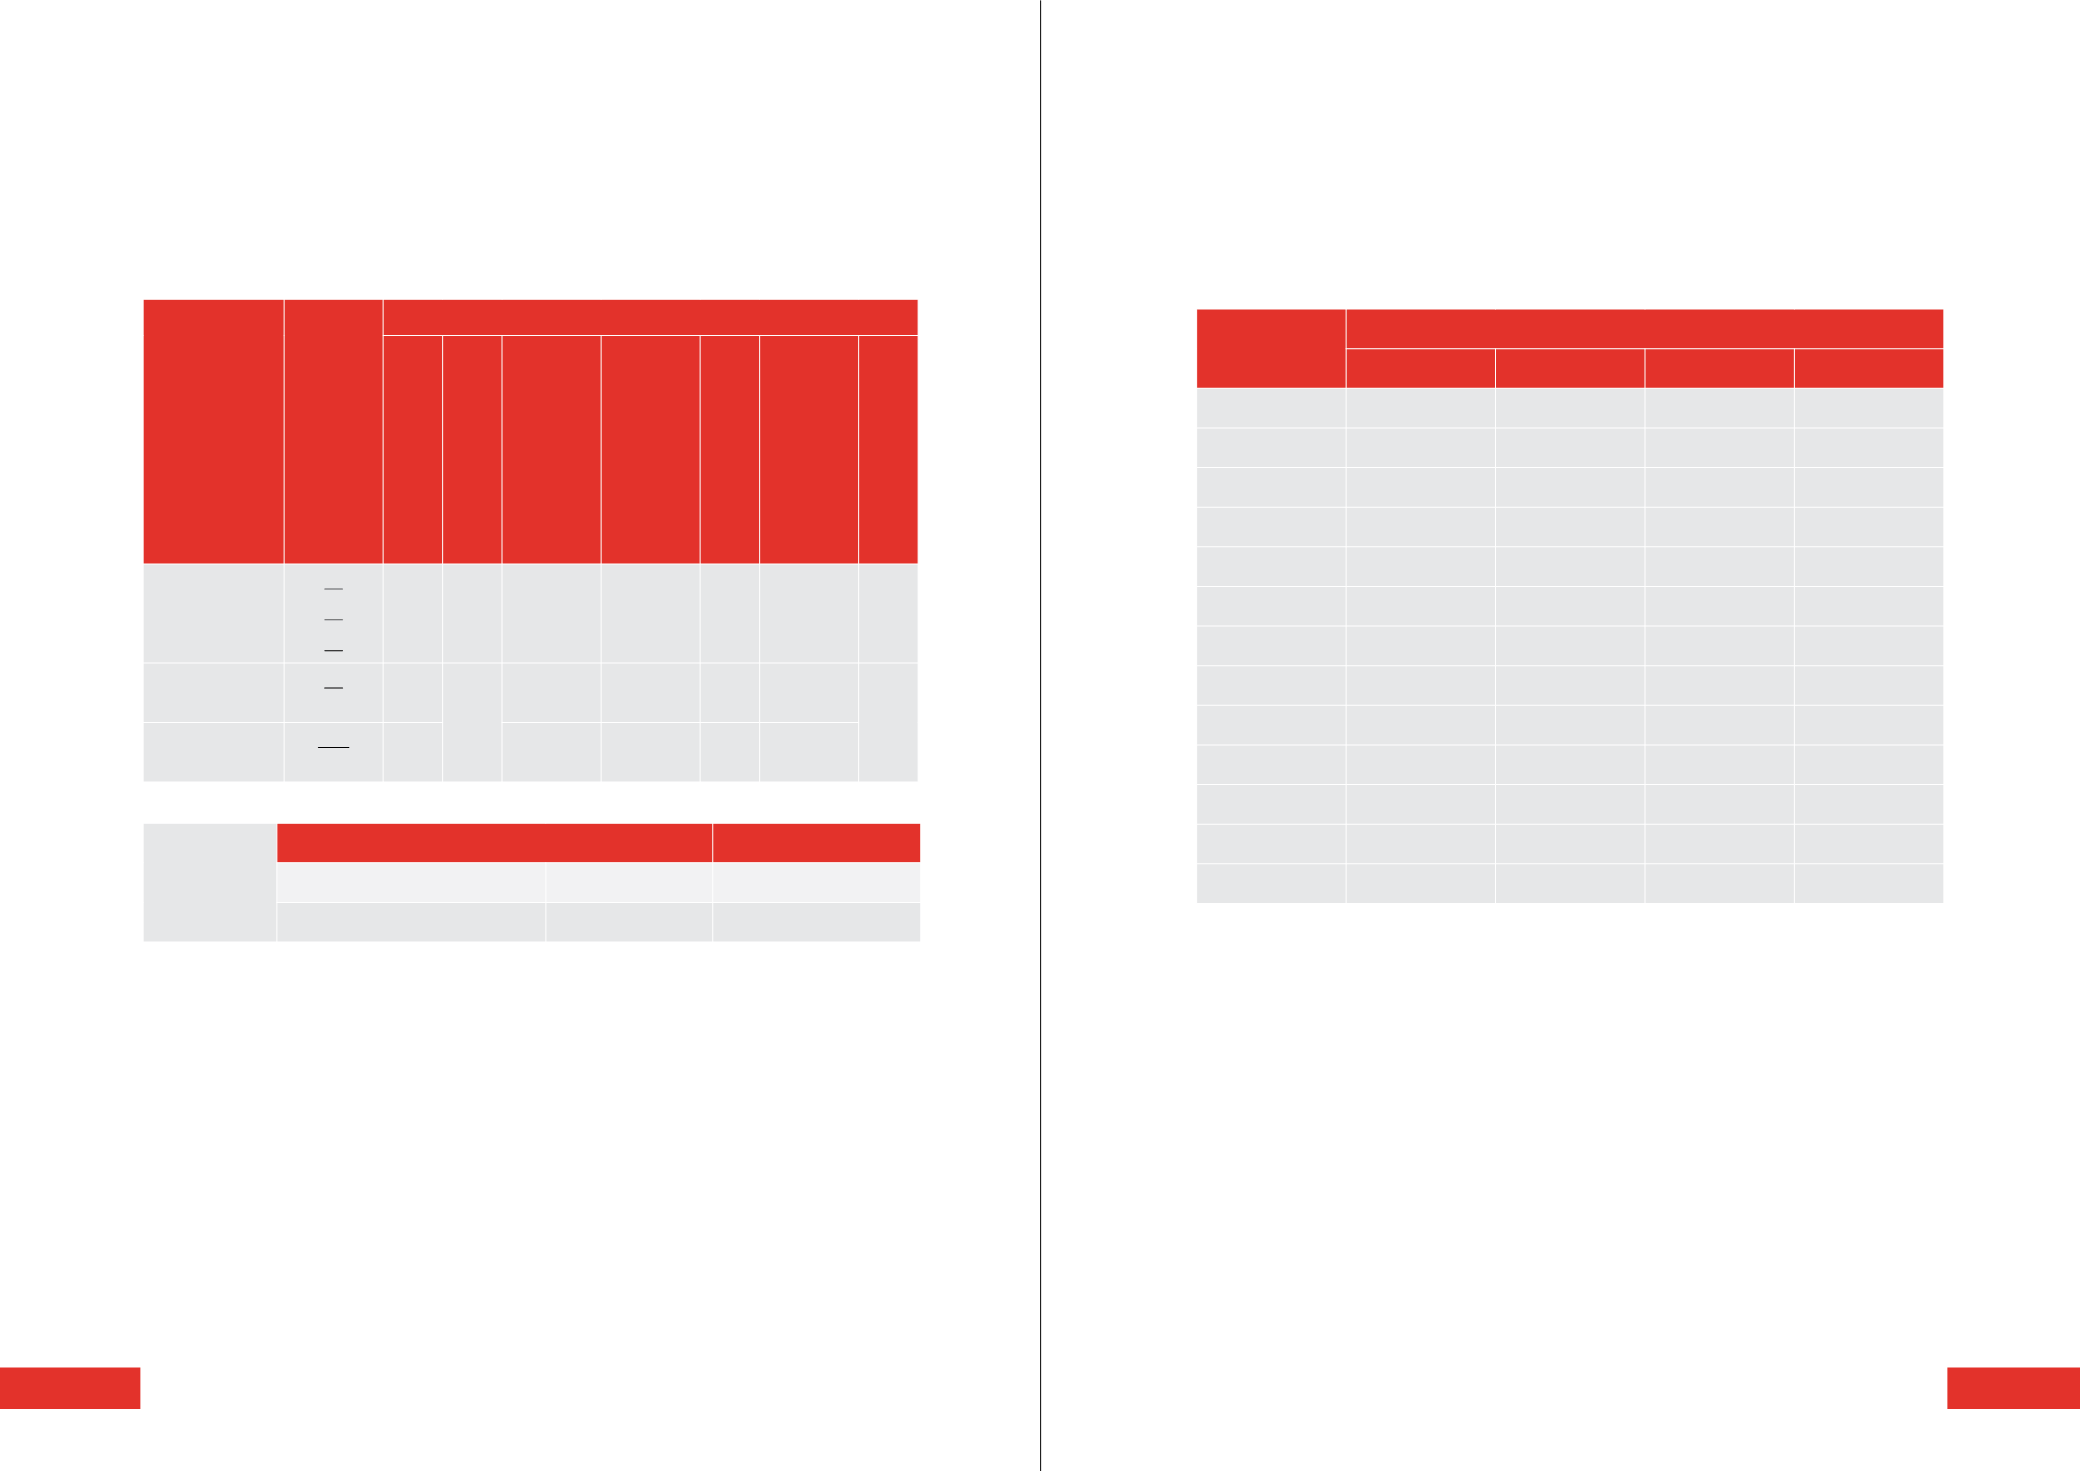
Detailed Reserves & Resources by Asset
Asset
WI Reserves and Resources (mmboe)
Country
1P
2P
2C
Burg El Arab
Egypt
0.6
5.0
10.5
Area A
Egypt
3.0
12.1
-
Abu Sennan
Egypt
0.9
3.4
-
ERQ
Egypt
6.4
11.5
-
Block 43
Yemen
-
-
0.1
Block 5
Yemen
3.3
4.2
8.3
KSF
Oman
-
-
-
Siba
Iraq
30.0
58.1
12.2
Mansuriya
Iraq
46.4
69.6
8.4
Block 9
Iraq
168.4
507.5
708.0
Block 49
Yemen
-
-
11.7
Block 82
Yemen
-
-
-
Total
259.0
671.3
759.4
Notes:
1. Certified figures by GCA.
2. KSF (Oman) which cannot be included in external reserves reporting as per contract.