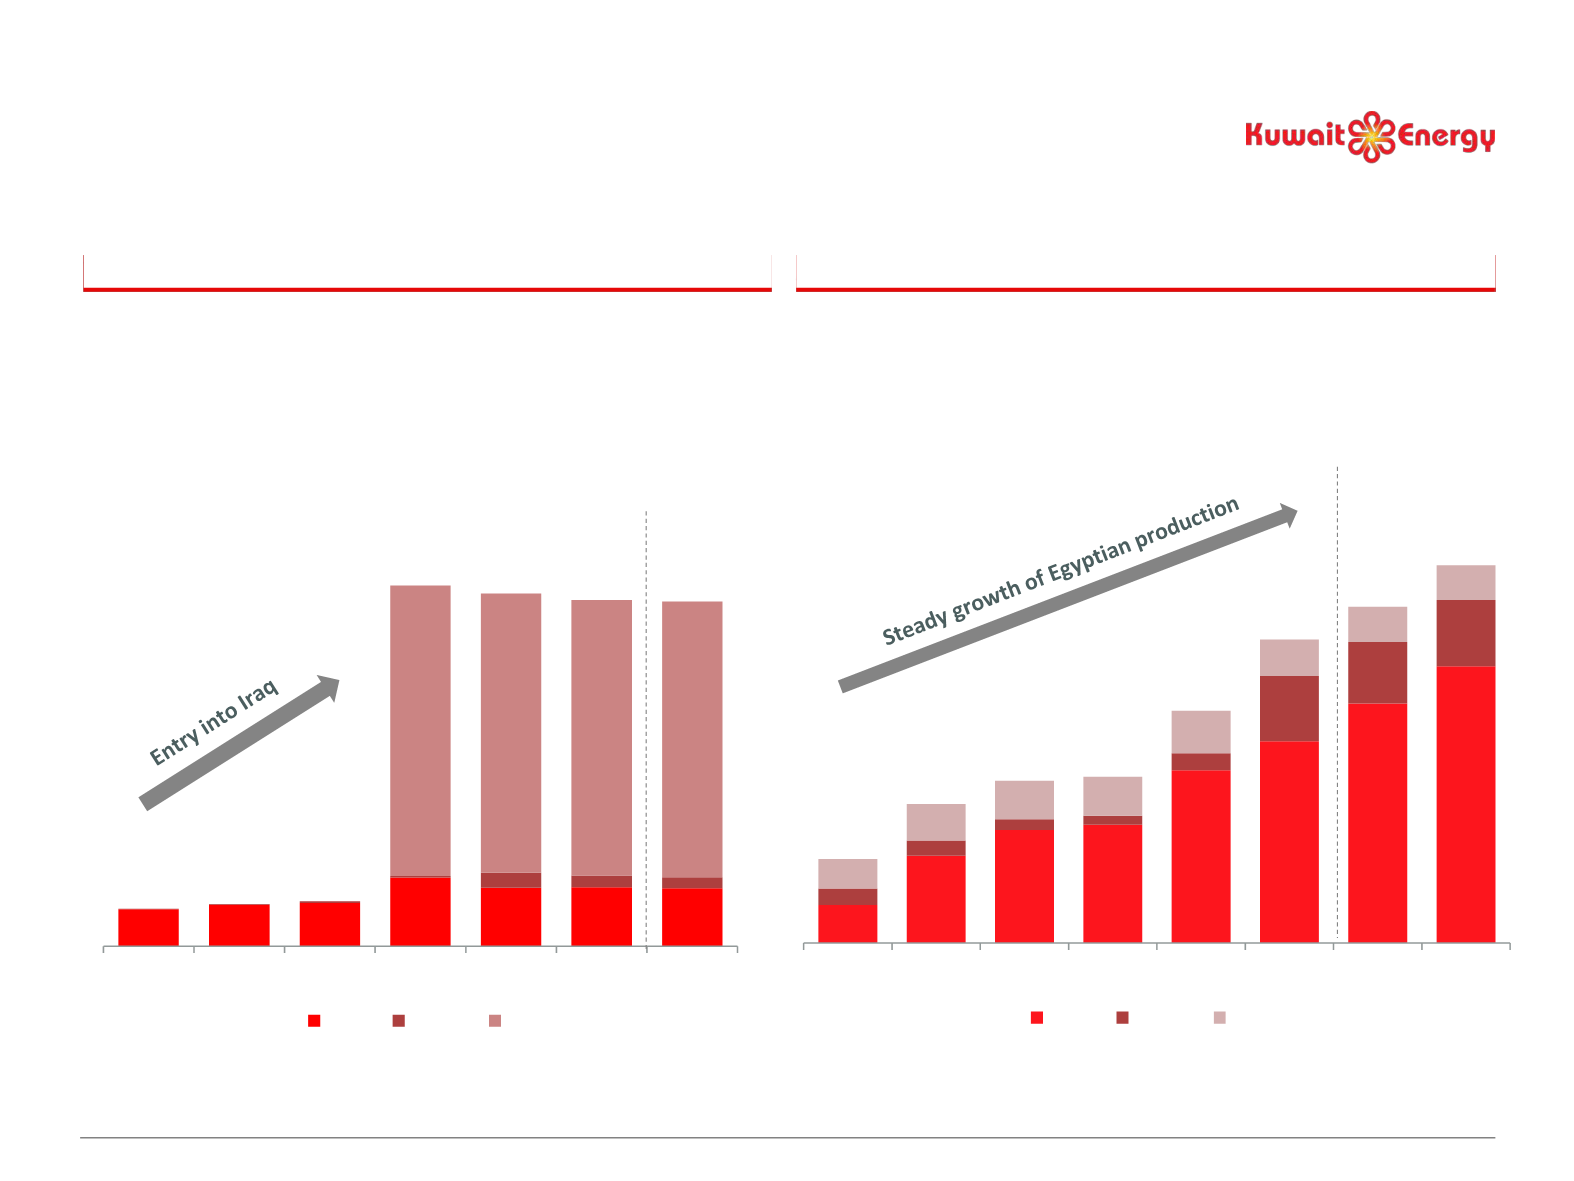
17.8 19.9 20.9
33.1 28.1 28.4 27.9
0.3
0.4
0.7
0.7
7.3
5.6
5.3
139.7
134.3
132.5 132.5
2008 2009 2010 2011 2012 2013 May-14
Egypt Yemen Iraq
2,738
6,293
8,154 8,529
12,454
14,553
17,282
19,965
1,185
1,093
775
636
1,219
4,717
4,429
4,780
2,128
2,635
2,757 2,825
3,065
2,628
2,538
2,503
6,050
10,021
11,687
11,990
16,738
21,898
24,250
27,248
2008 2009 2010 2011 2012 2013 YTD Nov
2014
Nov-14
Egypt Yemen Oman
Source: Kuwait Energy, GCA reports YE2009 to 2013, 31 May 2014.
Note:
Information provided only includes MENA assets. The reserves, contingent resources and prospective resources estimates contained in this presentation are all based on 31 May 2014 reports. YE2008 2P reserves KEC
estimates and have not been audited
(1) YE 2008-2013 period (2) Production as at 30 Nov2014
Solid Track Record of delivery; Consistent
Reserves, Resources and Production Growth
Rapid maturation from resources to reserves
CAGR 2008 to 31 May 2014 of c.50% p.a.
Exploration success of 46%
(1)
(boepd)
(mmboe)
169.7 166.5
173.4
21.6
20.3
18.1
9
165.7
Consistent growth in production since inception
CAGR 2008 to 1H 2014 of c.28% p.a.
(2)
WI 2P Reserves
Average Production


