


 4 / 10

3
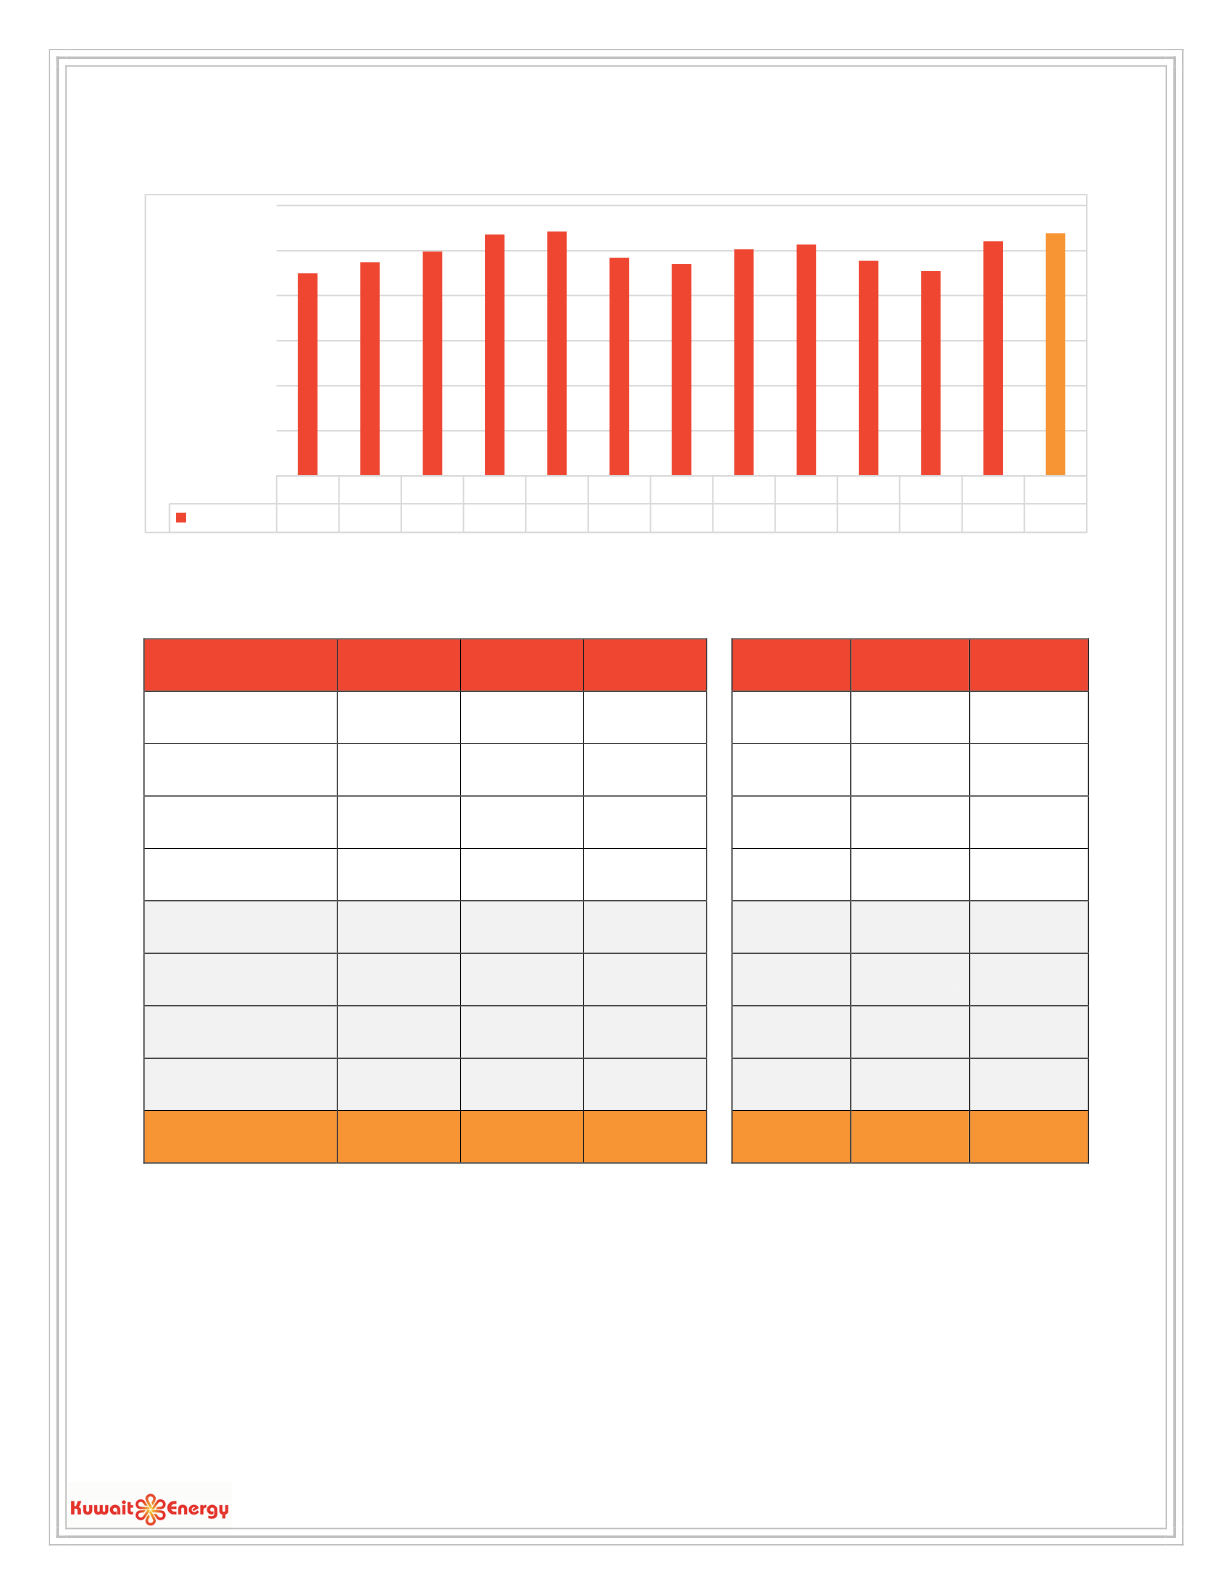
The chart below shows
quarter-by-quarter daily WI average production
of the Company from Q1 2014 to Q1 2017:
Kuwait Energy’s
daily average WI share of production for Q1 2017 compared to Q4 2016
and
YTD figures compared
to those for the last calendar year
per asset are shown in the table below (in boepd):
Q1 2017
Q4 2016
% Change
YTD Actual
Average
for 2016
%
Difference
Abu Sennan
1,633
1,721
-5.11
1,633
1,879
-13.09
BEA
1,051
1,072
-1.96
1,051
1,380
-23.84
Area A
4,816
5,089
-5.36
4,816
5,055
-4.73
ERQ
8,838
9,198
-3.91
8,838
9,842
-10.20
Egypt Total
16,338
17,080
-4.34
16,338
18,155
-10.01
Iraq Total
(Block 9)
8,033
6,487
23.83
8,033
3,974
102.14
Oman Total
(Karim Small Fields)
2,569
2,475
3.76
2,569
2,444
5.11
Yemen Total*
0
0
-
0
0
0
Production Total
26,941
26,041
3.45
26,941
24,573
9.64
* Yemen production has been suspended since April 2015
Q1 14 Q2 14 Q3 14 Q4 14 Q1 15 Q2 15 Q3 15 Q4 15 Q1 16 Q2 16 Q3 16 Q4 16 Q1 17
Production 22,467 23,720 24,921 26,780 27,099 24,223 23,522 25,151 25,679 23,859 22,742 26,041 26,941
0
5,000
10,000
15,000
20,000
25,000
30,000
BOPD