


 8 / 49

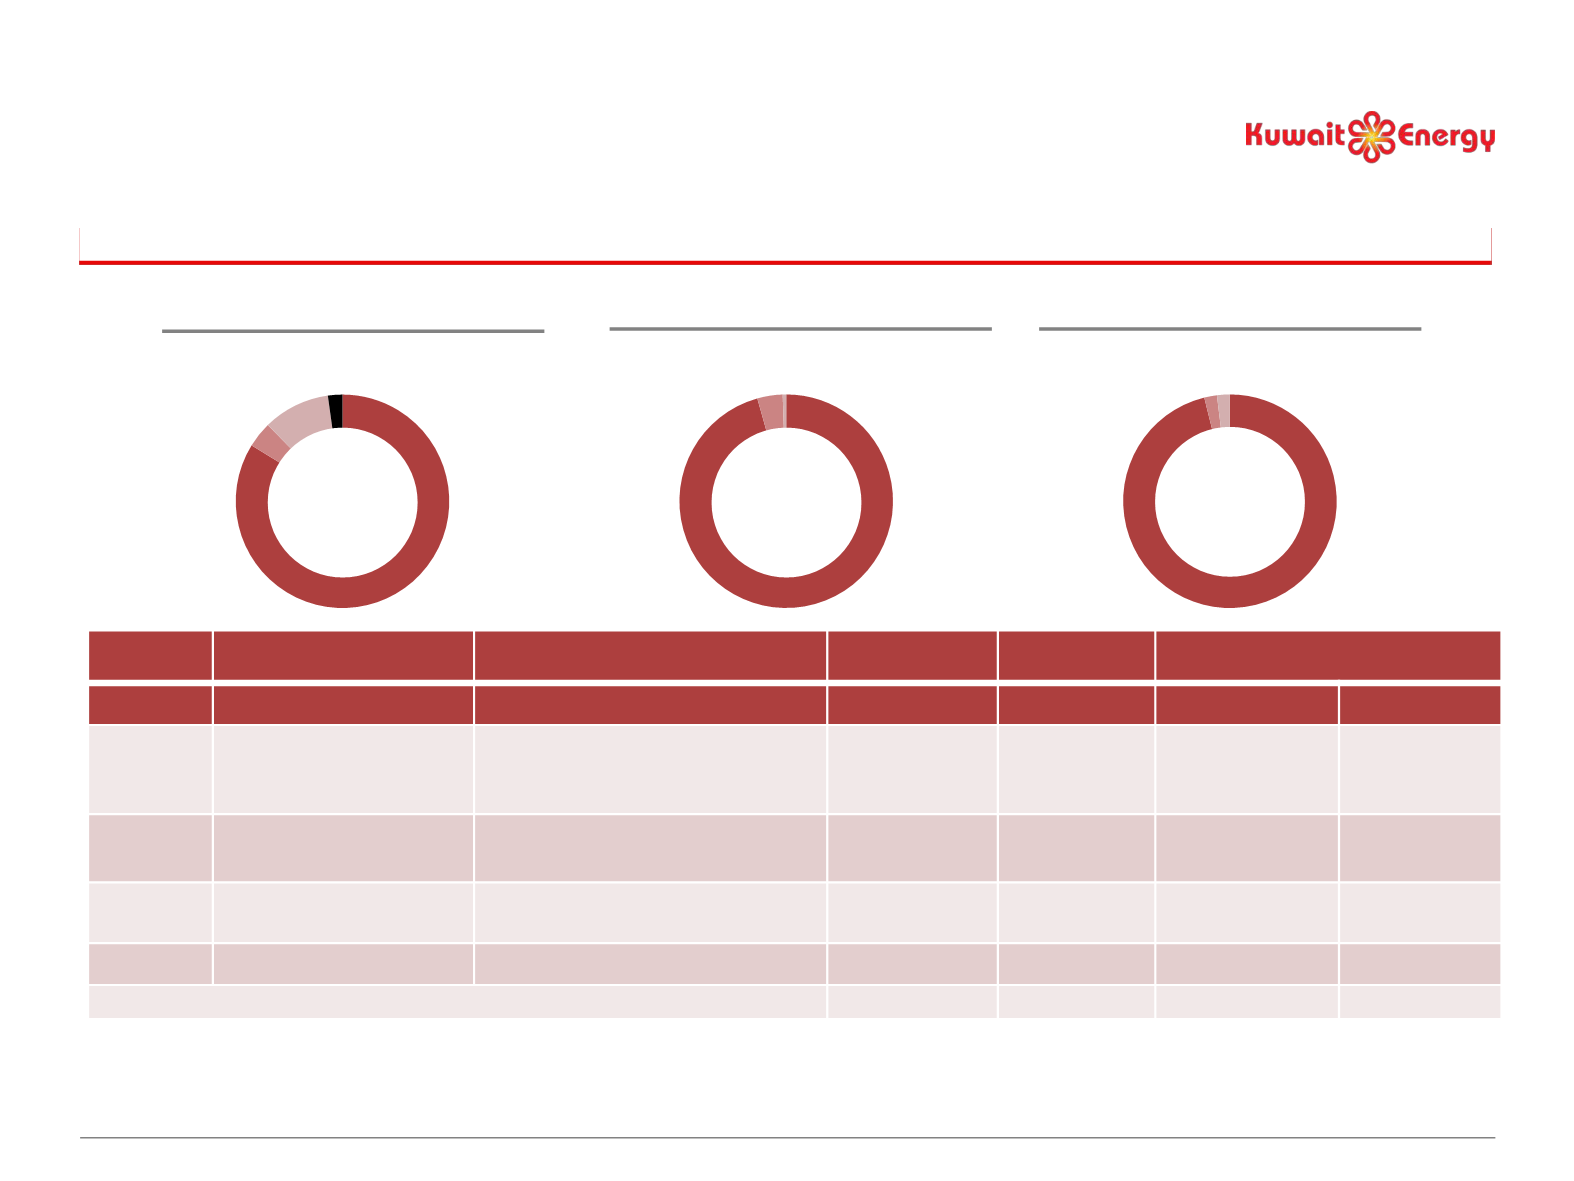
Solid Reserves Base and Resources with
Mostly Operated Positions
Kuwait Energy’s Asset Portfolio Overview
Iraq
96%
Egypt
4%
Yemen
0%
83% oil
Iraq
96%
Egypt
2%
Yemen
2%
85% oil
Egypt
84%
Yemen
4%
Oman
10%
Iraq
2%
98% oil
Country
Assets
Status
2P (mmboe)
(2)
2C (mmboe)
(2)
WI Production (boepd)
(1)
2015
Q1 2016
Iraq
Block 9*, Siba*,
Mansuriya
Producing, Development, Appraisal,
Exploration
783
906
549
(4)
3,396
Egypt
Burg El Arab*, Area A*
Abu Sennan*, ERQ
Producing, Exploration
31
18
20,942
19,809
Yemen
Block 5*, Block 49*
Producing, Exploration
4
18
976
(3)
–
Oman
(3)
KSF
Producing
–
–
2,533
2,541
Total
818
942
25,000
25,747
Note: * denotes Kuwait Energy operatorship.
(1) 2015 average daily working interest production.
(2) Figures based on GCA reported number as at 31 December 2015. Oman reserves not included due to service contract restrictions.
(3) Includes production from Block 43 which Kuwait Energy has withdrawn from, effective 30 June 2015.
(4) As of October 2015, Block 9, Iraq commenced production from Faihaa-1 well at the rate of 5,000 bpd on 32/64 inch choke.
Production 25 kboepd
(1)
2P WI Reserves 818 mmboe
(2)(3)
2C WI Resources 942 mmboe
(2)(3)
8