


 25 / 37

139
183
262
271
156
139
146
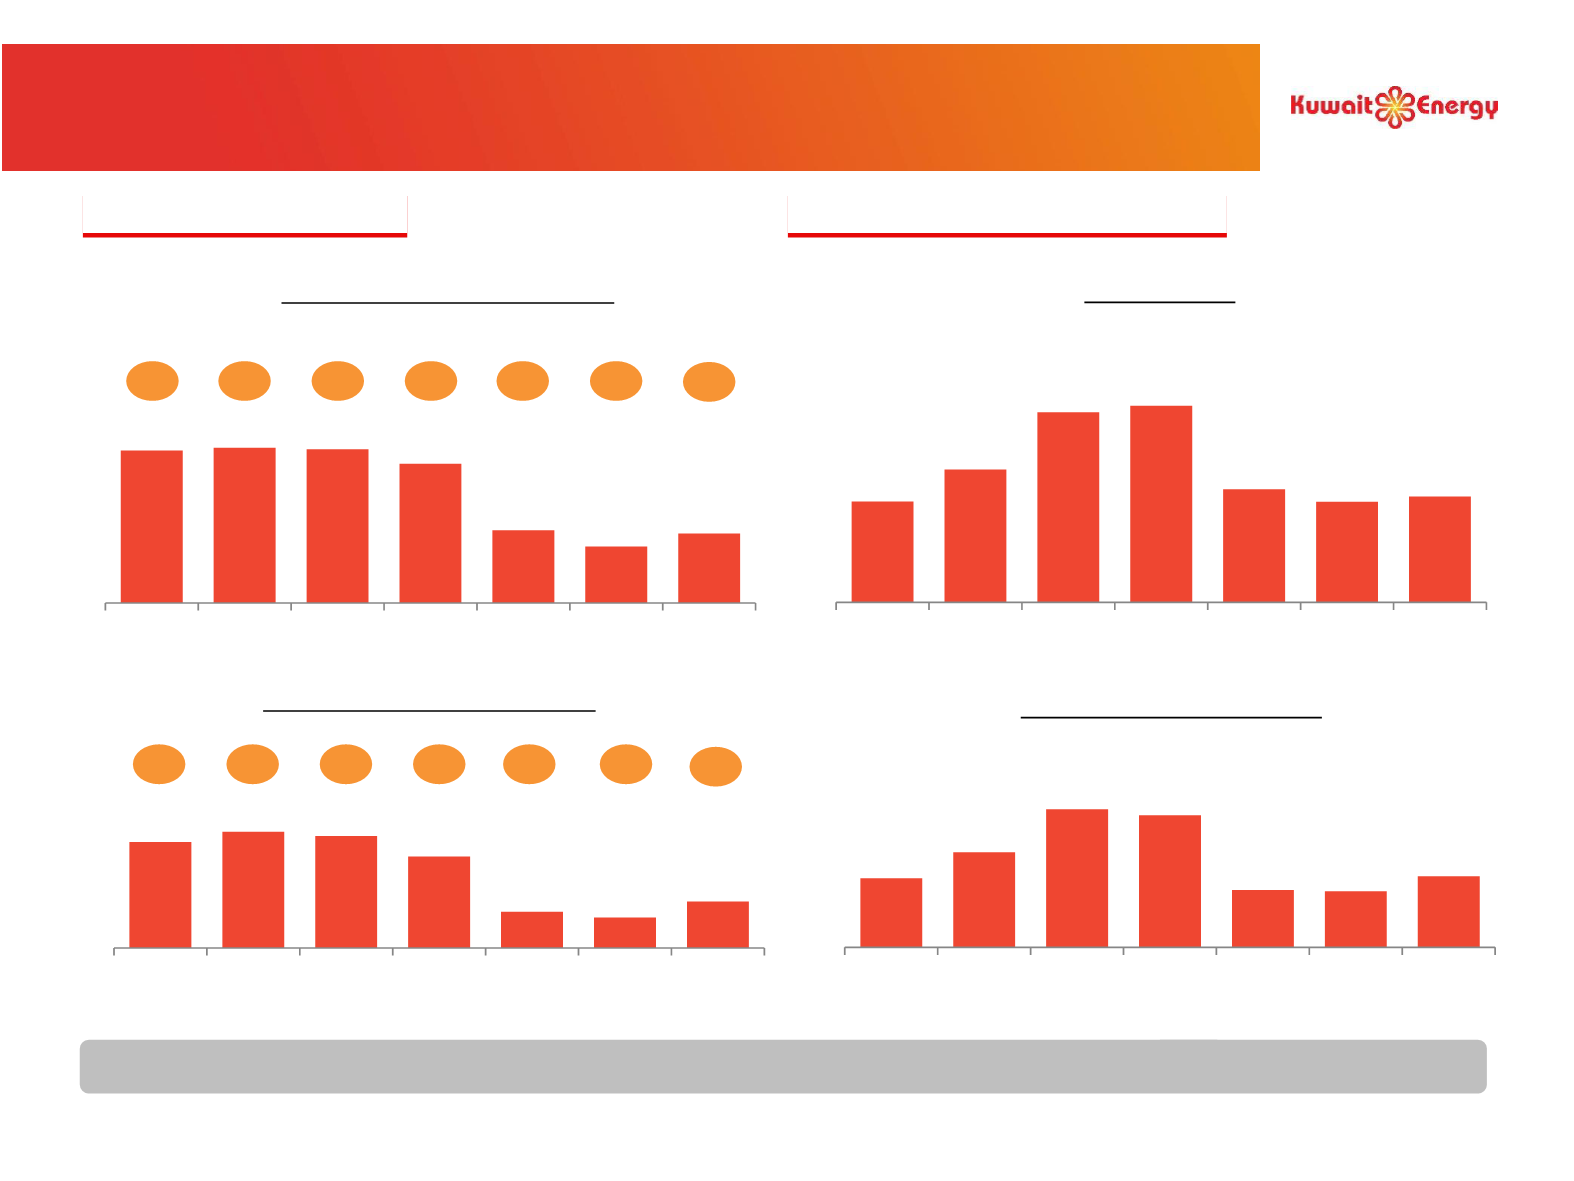
2011 2012 2013 2014 2015 2016 YTD-Sept
2017
105 107 106
96
50
39
48
2011 2012 2013 2014 2015 2016 YTD-Sept
2017
High Margin Production
Consistent Cash Flow Generation
73
80
77
63
25
21
32
2011 2012 2013 2014 2015 2016 YTD-Sept
2017
Average Realised Price ($/boe)
Operating Cash Flow ($/boe)
(1)
95
131
190 182
79
77
98
2011 2012 2013 2014 2015 2016 YTD-Sept
2017
Revenue ($m)
Operating Cash Flow ($m)
(1)
69% 72% 72% 67% 51% 56%
OCF
margin
Source: Company filing.
(1) Represents operating cash flow before change in working capital.
(2) Mansuriya on administrative hold; remuneration fee in respect of Siba and Mansuriya deferred until cost pool is below 50% of revenue in a given period; ‘remuneration’ revenue is as defined/interpreted in the
underlying concession agreements.
Iraqi remuneration revenue is not sensitive to oil price volatility
8.3
7.1
8.0
7.2
7.8
5.9
Opex/boe
24
Operations with Cash Generative Assets
(2)
4.5
67%