


 8 / 37

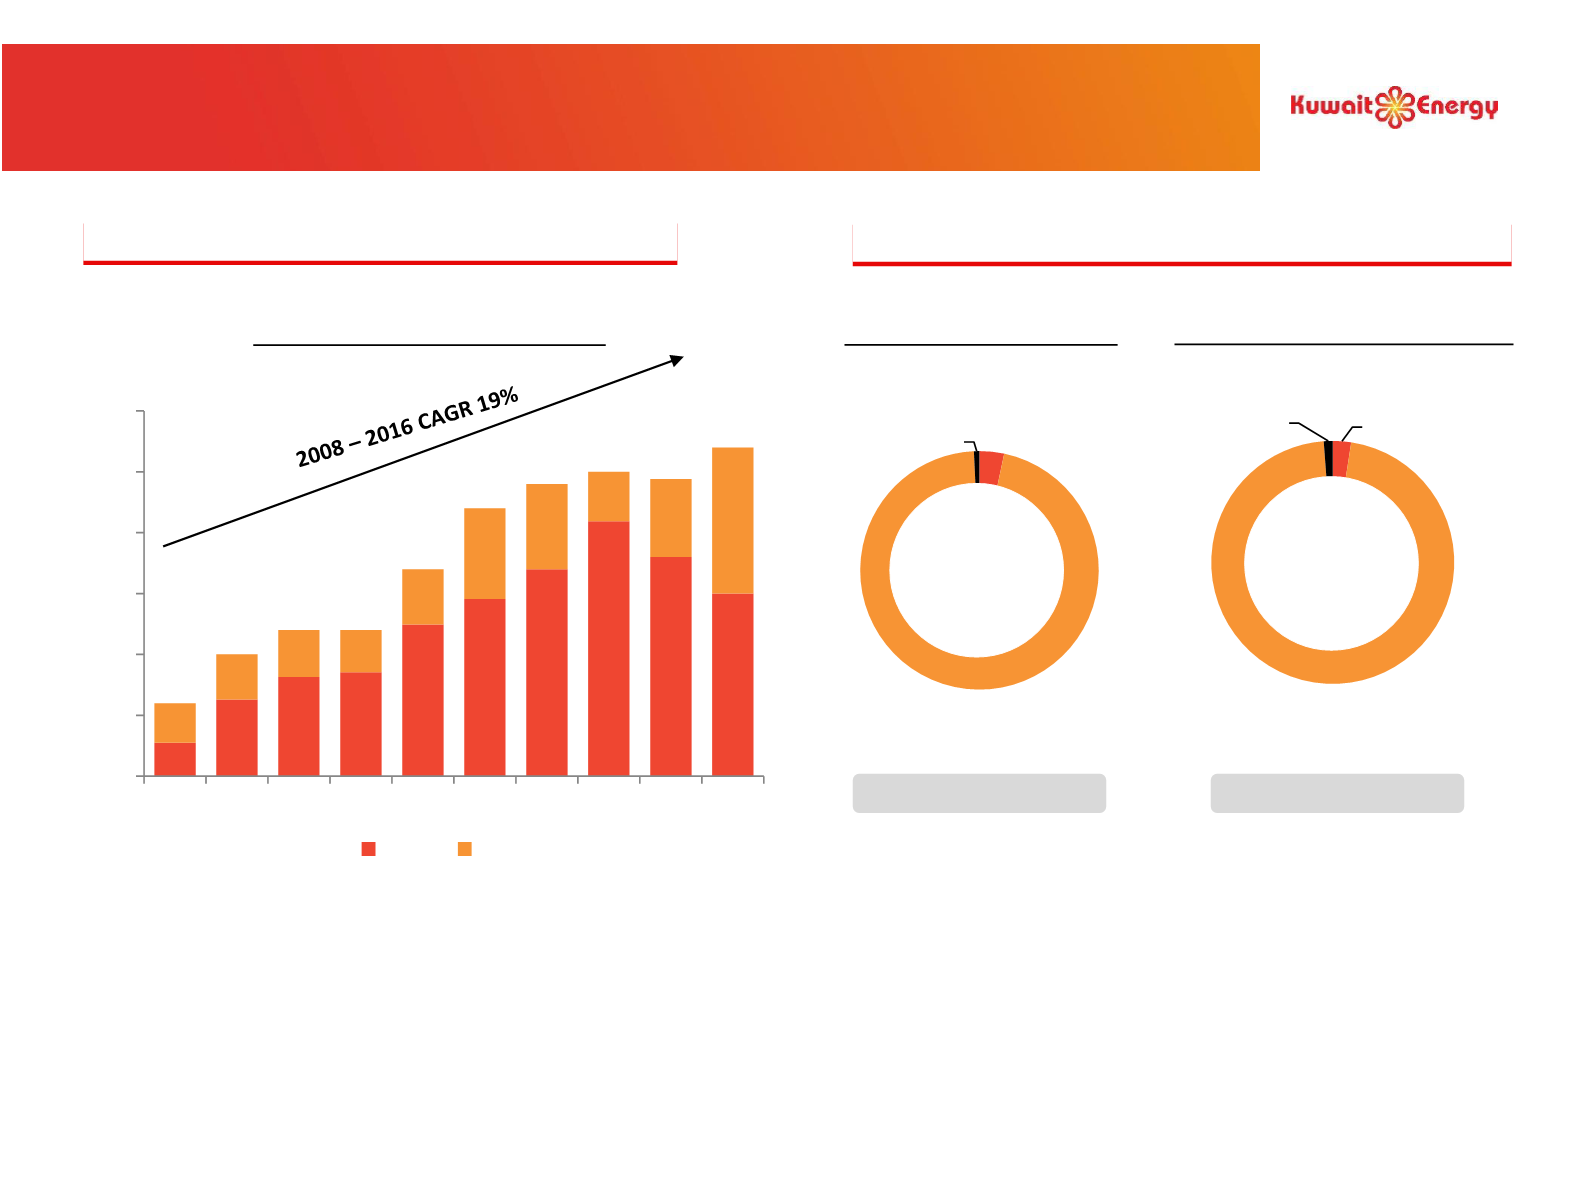
WI Average Production (kboe/d)
Egypt
3.3%
Iraq
96.0%
Yemen
0.7%
Egypt
2.4%
Iraq
96.4%
Yemen
1.2%
Historical Production Growth Driven by Egypt
Iraqi Reserves & Resources to Drive Future Growth
WI 2P Reserves (mmboe)
WI 2P + 2C Resources (mmboe)
Source: Company filings, GCA report
.
Note: Totals may differ from sums of line items presented as a result of rounding. Reserves and resources figures based on GCA report as at 31 December 2016, prior to Siba and Abu Sennan farm-out and excludes Oman
reserves due to service contract restrictions. 2016 production figures based on reconciled numbers; all other production figures based on Kuwait Energy Quarterly Production Reports.
810 mmboe
85% Liquids
1,850 mmboe
85% Liquids
93% operated
96% operated
7
o
Egypt has been the key driver of growth since 2008 with 25 discoveries resulting in 50% exploration drilling success
rate
o
Kuwait Energy expects Iraqi assets to contribute to production growth from 2017
Existing Production Supports Iraq Development
3
6 8 9
12
15
17
21
18
15
3
4
4 3
5
7
7
4
6 12
6
10
12 12
17
22
24 25 24
27
0
5
10
15
20
25
30
2008 2009 2010 2011 2012 2013 2014 2015 2016 YE
2017
Egypt Other