Second Quarter 2014 Activity Report
Page 8
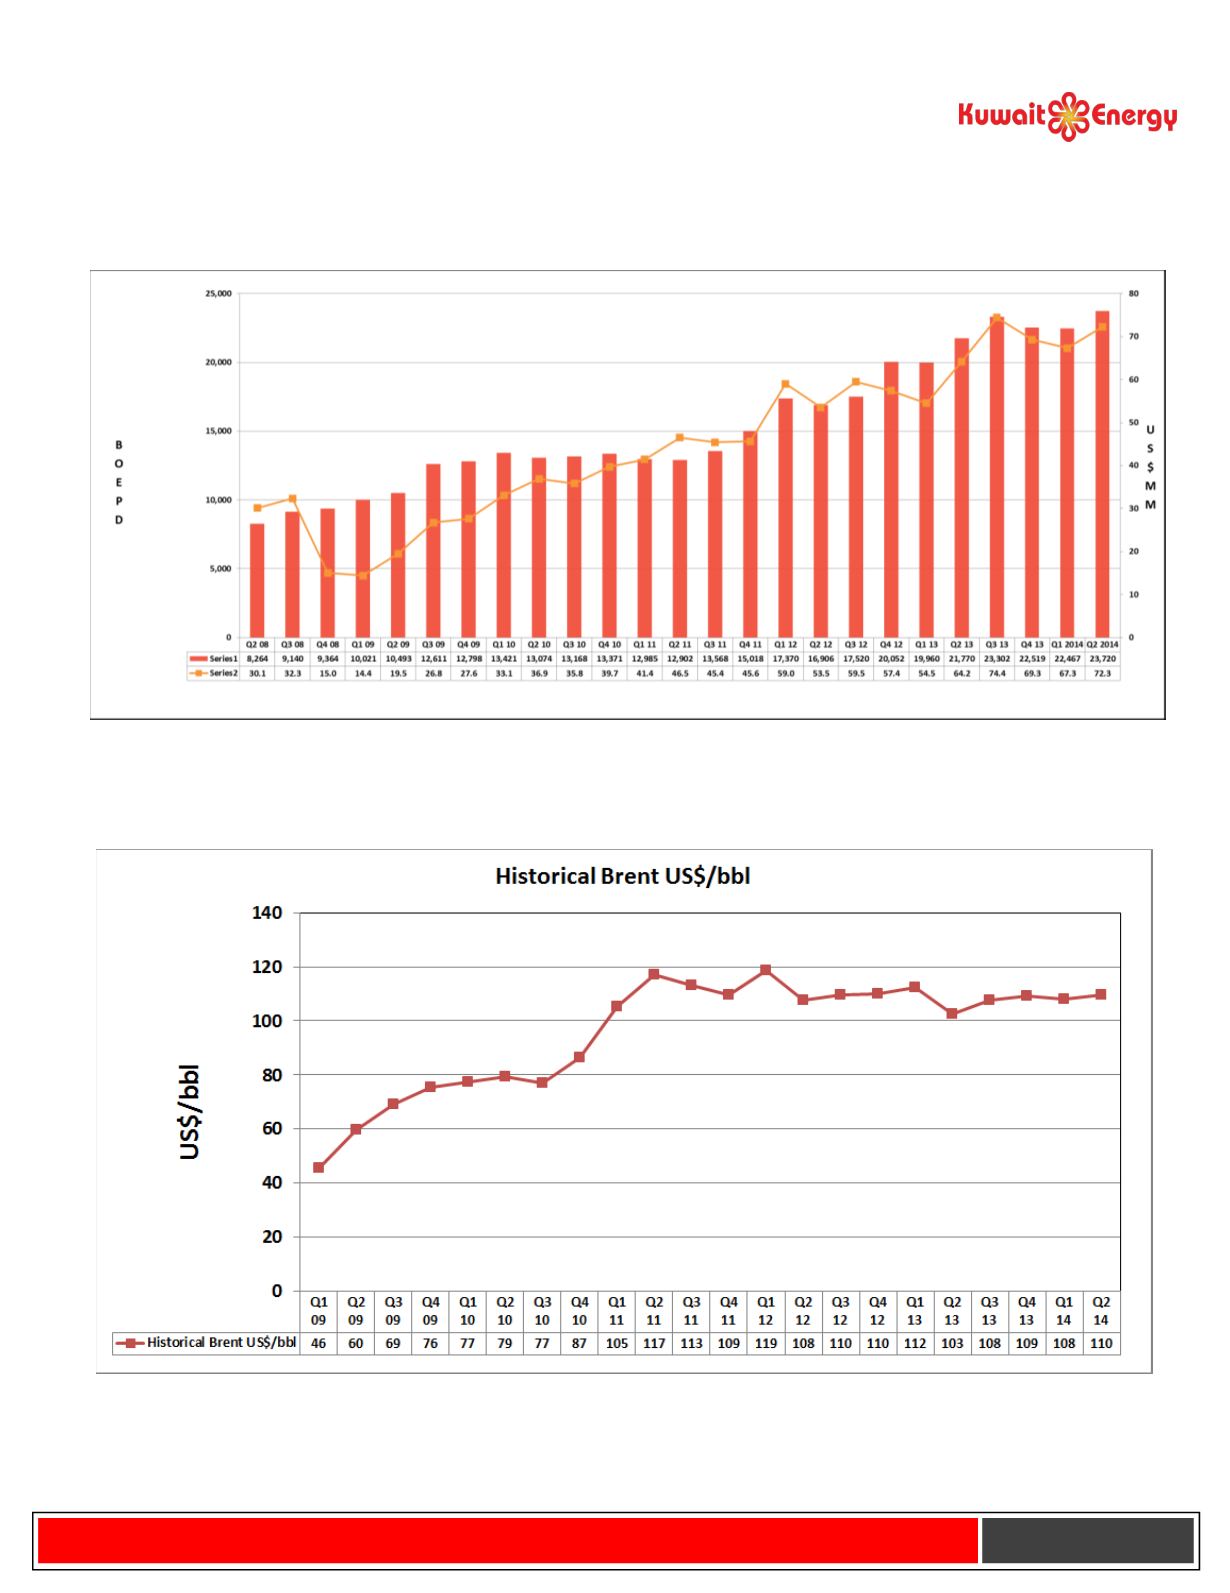
Quarterly Revenue and Production
The chart below shows quarter-by-quarter daily average production (boepd) and revenue from Q1 2009 to Q2
2014:
* The financial numbers for 2013 are restated on account of (a) Eurasia assets being classified as ‘held for sale’ as per 2013 audited
accounts (b) Oman numbers being excluded due to application of IFRS 11 applicable from 1 Jan 2014.
Brent Crude Oil Price
Source: EIA


