


 25 / 35

139
183
262
271
156
139
2011 2012 2013 2014 2015 2016
105
107
106
96
50
39
2011 2012 2013 2014 2015 2016
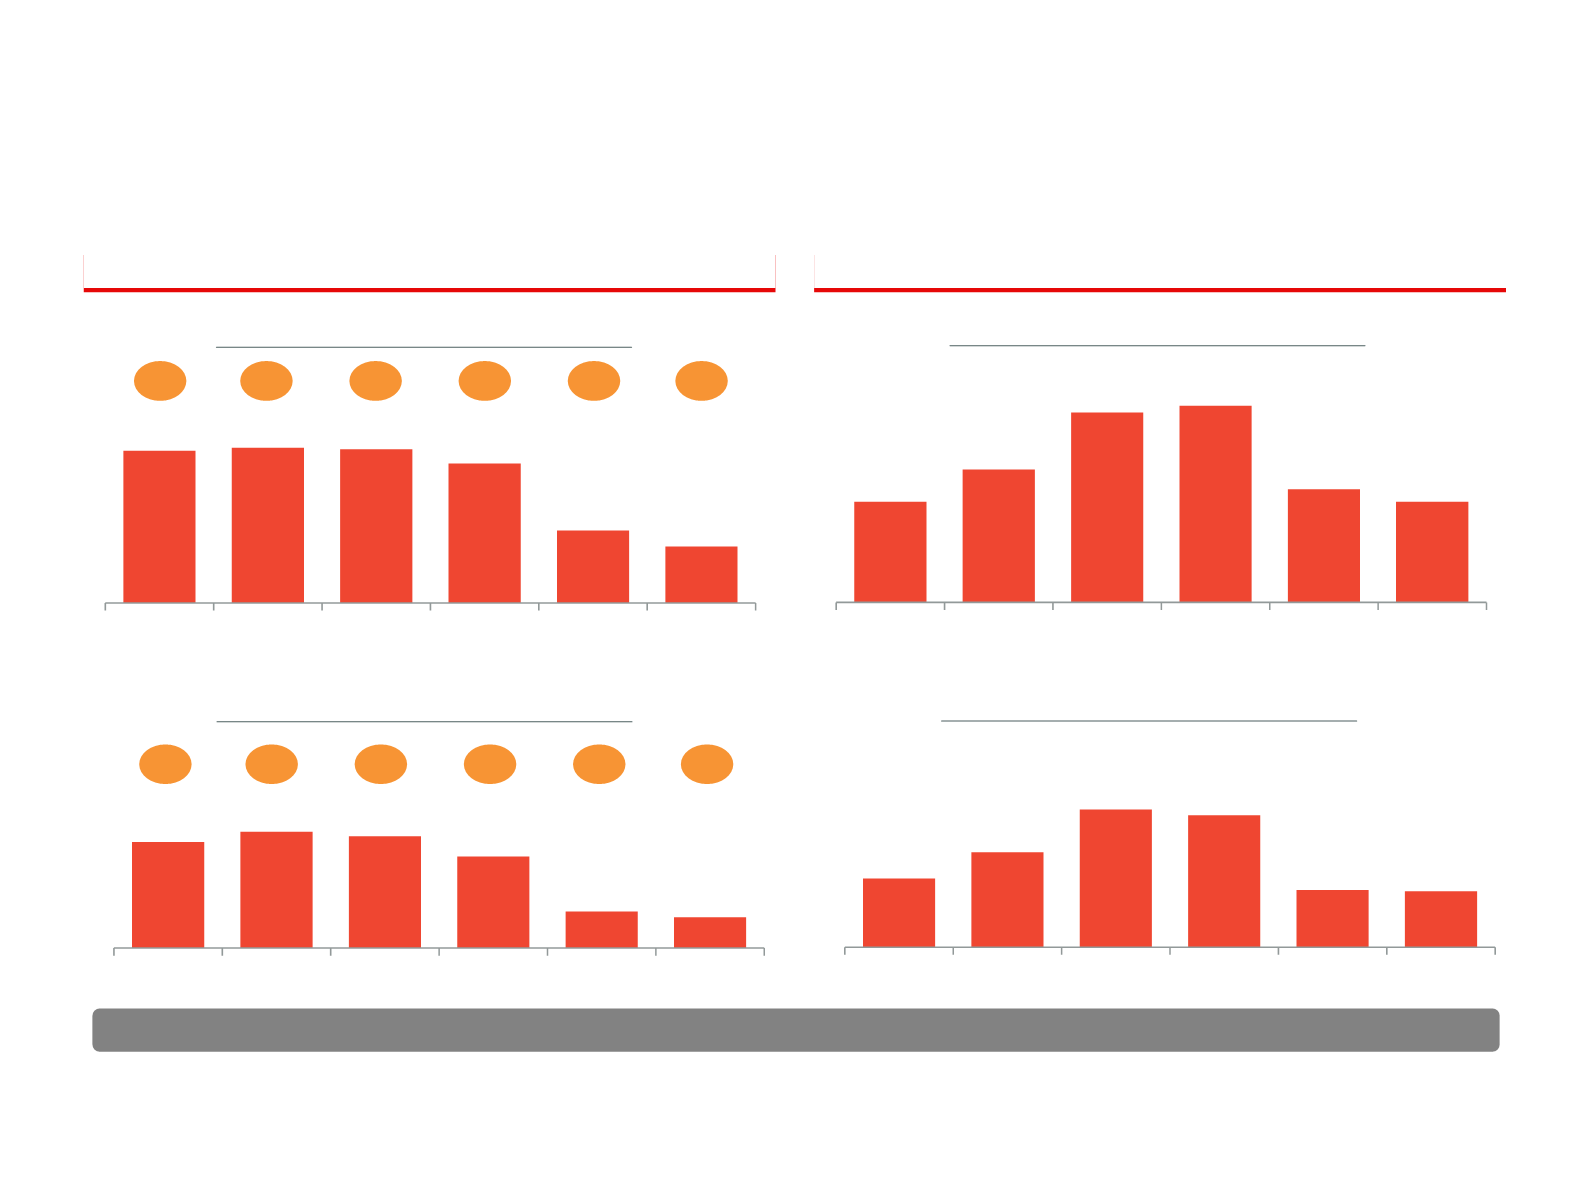
High Margin Production
Consistent Cash Flow Generation
73
80
77
63
25
21
2011 2012 2013 2014 2015 2016
Average Realised Price ($/boe)
Operating Cash Flow ($/boe)
(1)
95
131
190
182
79
77
2011 2012 2013 2014 2015 2016
Revenue ($m)
Operating Cash Flow ($m)
(1)
69% 72% 72% 67% 51% 56%
OCF
margin
Source: Company filing.
(1) Represents operating cash flow before change in working capital.
(2) Mansuriya on administrative hold; remuneration fee in respect of Siba and Mansuriya deferred until cost pool is below 50% of revenue in a given period; ‘remuneration’ revenue is as defined/interpreted in the
underlying concession agreements.
Operations with Cash Generative Assets
Iraqi remuneration revenue is not sensitive to oil price volatility
(2)
8.3
7.1
8.0
7.2
7.8
5.9
Opex/boe
24