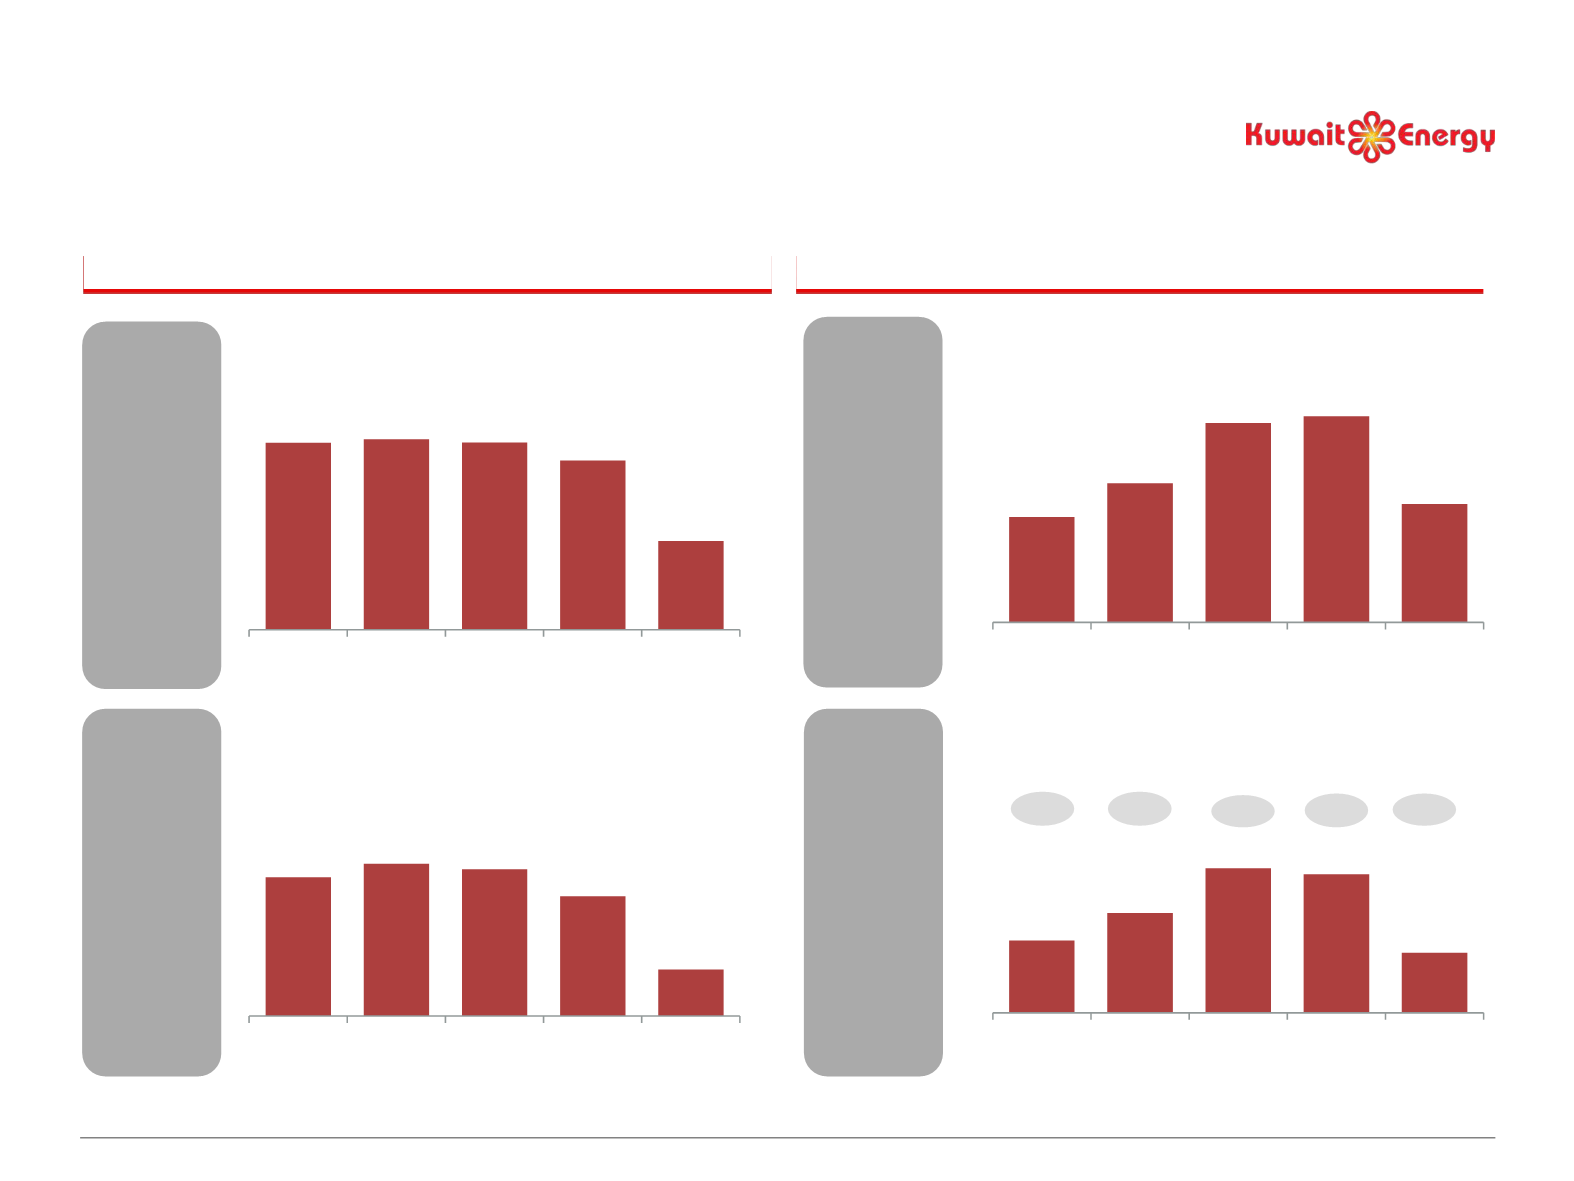

Operations with Strong Cash Generative
Assets
(1) Operating cash flow before working capital changes.
Revenues
($m)
139
183
262
271
156
2011 2012 2013 2014 2015
Operating
Cash Flow
per
boe ($)
(1)
73
80
77
63
25
2011 2012 2013 2014 2015
105
107
106
96
50
2011 2012 2013 2014 2015
Average
Realised
Price per
boe ($)
95
131
190
182
79
2011 2012 2013 2014 2015
Operating
Cash Flow
($m)
(1)
69% 72% 72% 67% 51%
OCF
margin
High Margin Production
Strong Cash Flow Generation
44


